New Zealand’s exports to China trump sales to Australia and the United States
New Zealand’s goods and services exports are dominated by three key countries, led by China, then Australia and the United States, Stats NZ said today.
China is New Zealand’s single-biggest export market, accounting for around one in every five dollars of sales of goods and services overseas, according to data first released by Stats NZ in December 2018 (see Goods and services trade by country: Year ended September 2018).
New Zealand’s exports of all goods and services to China were worth $16.6 billion for the year ended September 2018, $2.6 billion more than Australia and almost double the sales to the United States.
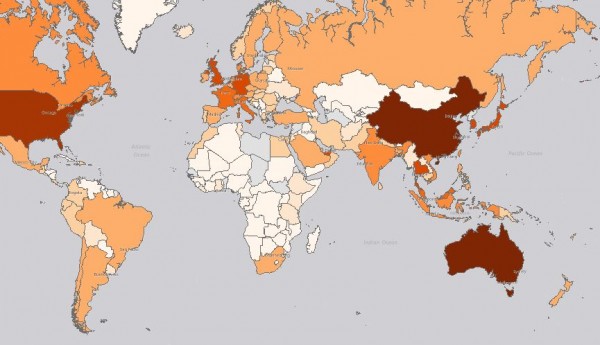
New Zealand’s imports and exports for the year ended September 2018, interactive map (see above).
Since the year ended September 2016, China has consistently been New Zealand’s top goods export partner. In the past, Australia had almost always been our top goods export partner, only overtaken by China in the year ended December 2013. If the European Union is excluded (because of uncertainty around Brexit), the United States becomes New Zealand’s third-largest export market.
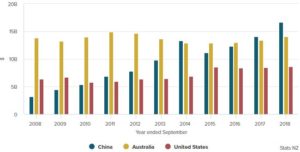
Total goods and services exports ($) to China, Australia, and the United States,2008–18
| Year ended September | China | Australia | United States |
|---|---|---|---|
| 2008 | 3157000000 | 13823000000 | 6325000000 |
| 2009 | 4445000000 | 13205000000 | 6658000000 |
| 2010 | 5318000000 | 13982000000 | 5787000000 |
| 2011 | 6828000000 | 14880000000 | 5914000000 |
| 2012 | 7744000000 | 14679000000 | 6386000000 |
| 2013 | 9776000000 | 13617000000 | 6411000000 |
| 2014 | 13296000000 | 12909000000 | 6842000000 |
| 2015 | 11125000000 | 12901000000 | 8511000000 |
| 2016 | 12305000000 | 12956000000 | 8405000000 |
| 2017 | 14038000000 | 13417000000 | 8460000000 |
| 2018 | 16620000000 | 14037000000 | 8587000000 |
Exports by destination, New Zealand’s top ten export markets, year ended September 2018
| Destination | Goods | Services | Total | ||
| NZ$(million) | Rank | NZ$(million) | NZ$(million) | Rank | |
| China, People’s Republic of | 13,262 | 1 | 3,357 | 16,620 | 1 |
| Australia | 9,054 | 2 | 4,983 | 14,037 | 2 |
| European Union | 5,594 | 3 | 3,692 | 9,286 | 3 |
| United Kingdom | 1,496 | … | 1,450 | 2,946 | … |
| Germany | 849 | … | 839 | 1,688 | … |
| Netherlands | 888 | … | 172 | 1,060 | … |
| France | 327 | … | 453 | 780 | … |
| Italy | 329 | … | 75 | 404 | … |
| United States of America | 5,412 | 4 | 3,174 | 8,587 | 4 |
| Japan | 3,421 | 5 | 929 | 4,351 | 5 |
| Korea, Republic of | 1,690 | 6 | 579 | 2,269 | 6 |
| India | 696 | 17 | 1,289 | 1,985 | 7 |
| Singapore | 1,290 | 7 | 479 | 1,769 | 8 |
| Hong Kong (Special Administrative Region) | 1,252 | 8 | 500 | 1,752 | 9 |
| Taiwan | 1,187 | 9 | 221 | 1,408 | 10 |
China was New Zealand’s top export market for major exports including dairy products ($4.0 billion), logs and wood ($2.9 billion), and meat ($1.9 billion), for the year ended September 2018. The value of these sales has mostly risen over the past three years.
Travel was our largest services export to China – spending by Chinese visitors contributed $1.6 billion to the New Zealand economy. This was followed by Chinese students who studied in New Zealand ($1.3 billion) and transportation services ($225 million).
For both goods and services (combined), Australia was a slightly larger source of imports ($12.4 billion) than China ($12.2 billion), reflecting the high level of services imports from Australia.
For goods alone, China was the biggest single source of imports, worth $11.5 billion, much greater than New Zealand’s imports in goods from Australia ($6.8 billion), and the United States ($6.6 billion). (Note: Import values are published on a ‘value for duty’ (vfd) basis, ie without insurance and freight costs.)
Since the year ended September 2014, annual goods imports from China have risen 44 percent.
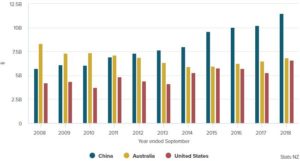
Total goods imports ($) from China, Australia, and the United States, 2008–18
| Year ended September | China | Australia | United States |
|---|---|---|---|
| 2008 | 5723000000 | 8345000000 | 4223000000 |
| 2009 | 6092000000 | 7317000000 | 4381000000 |
| 2010 | 6073000000 | 7348000000 | 3723000000 |
| 2011 | 6910000000 | 7098000000 | 4858000000 |
| 2012 | 7327000000 | 6888000000 | 4426000000 |
| 2013 | 7665000000 | 6338000000 | 4132000000 |
| 2014 | 7982000000 | 5906000000 | 5305000000 |
| 2015 | 9577000000 | 5977000000 | 5779000000 |
| 2016 | 10042000000 | 6236000000 | 5699000000 |
| 2017 | 10223000000 | 6470000000 | 5270000000 |
| 2018 | 11463000000 | 6840000000 | 6574000000 |
China was also a key source of electrical goods, such as cell phones. Imports of electrical machinery and equipment were worth $2.3 billion, and mechanical machinery and equipment $2.0 billion in the year ended September 2018. Over 40 percent of the total electrical machinery and equipment, and about a quarter of all mechanical machinery and equipment imported into New Zealand came from China.
China was a bigger supplier of those types of goods than the United States (mechanical machinery $1.5 billion, and electrical machinery $321 million) and a far bigger supplier of such goods than Australia.
New Zealanders who visited China spent $316 million in the year ended September 2018 – travel was the top service imported from China. The next was transportation services (passenger, freight, and other expenses associated with the transportation of people and cargo) at $233 million.
For the year ended September 2018, New Zealand’s largest trade surplus of $4.4 billion was with China – reflecting a much higher level of exports than imports – followed by Australia ($1.6 billion). New Zealand’s two-way trade with China in the year ended September 2018 was worth $28.8 billion, out of $160.7 billion in total two-way trade.
October 2018 marked the 10-year anniversary of the New Zealand–China free trade agreement.
Media enquiries
James Weir
021 285 9191
info@stats.govt.nz
Published on Stats.govt.nz on 5 Feburary 2019


 MENU
MENU